
Creative
Strategic
Dynamic
We’re a full-service agency powered by a core team of creative strategists and a national network of top-tier partners—bringing together the best in design, content, and digital to deliver bold, effective marketing for brands ready to grow.


From branding to content and campaigns, we help you scale, connect with your audience, and drive results. If you want your marketing to stand out, we’d love to connect.

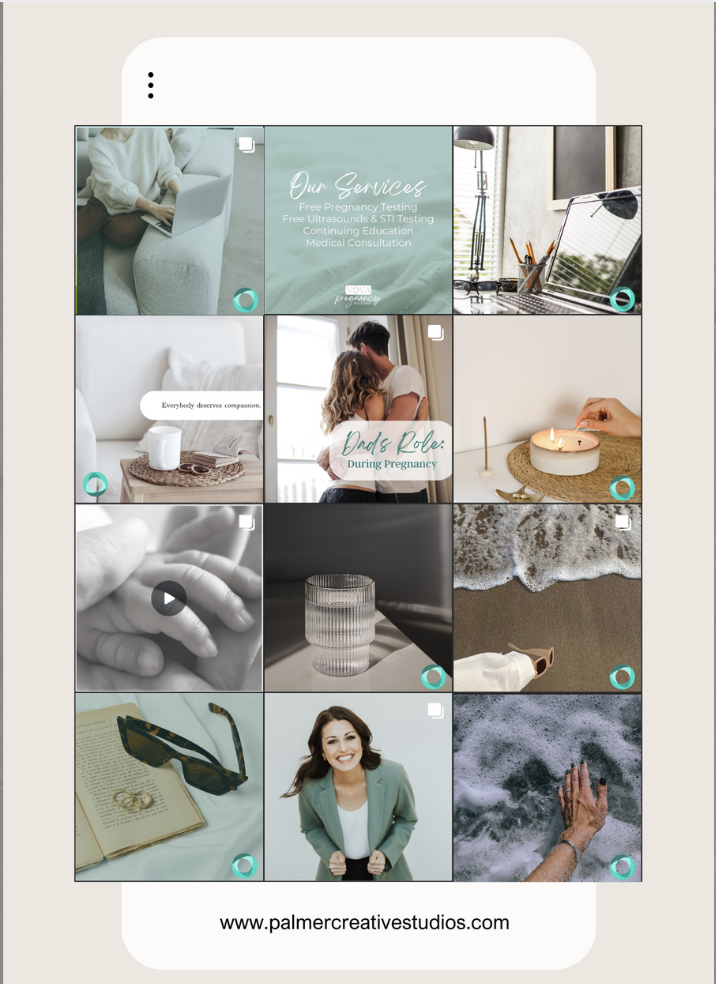
Froth Coffeererie


Intentional.
Inspired. Built for Impact.
At Palmer Creative Studios, we blend sharp strategy with refined storytelling. Rooted in creative excellence, we serve brands who are ready to grow with intention.
Our
Signature
Approach
We don’t just “do marketing.” We craft high-impact creative and digital strategy that reflects your mission—and gets results. From medical spas and nonprofits to government and legal teams, we build tailored campaigns that stand out in saturated markets.
Include bullets or visuals for:
Social Media Strategy
Brand Identity & Creative Direction
Web & Campaign Design
Messaging & Storytelling
Political & Nonprofit Campaigns

What
drives'
us
We believe great marketing begins with integrity and intention. That’s why we:
Take a boutique approach with every client
Prioritize relationship-driven work
Love both the art and value of what we do